
Kinetic Timeline
$4.99/month·all three in the Suite Bundle for$24.99/month·Pricing and licensing
Scope the whole report to a moment. Kinetic Timeline is a day-strip slicer: scroll to any date, select a day or drag a range, and every visual on the page follows — including both Kinetic maps.
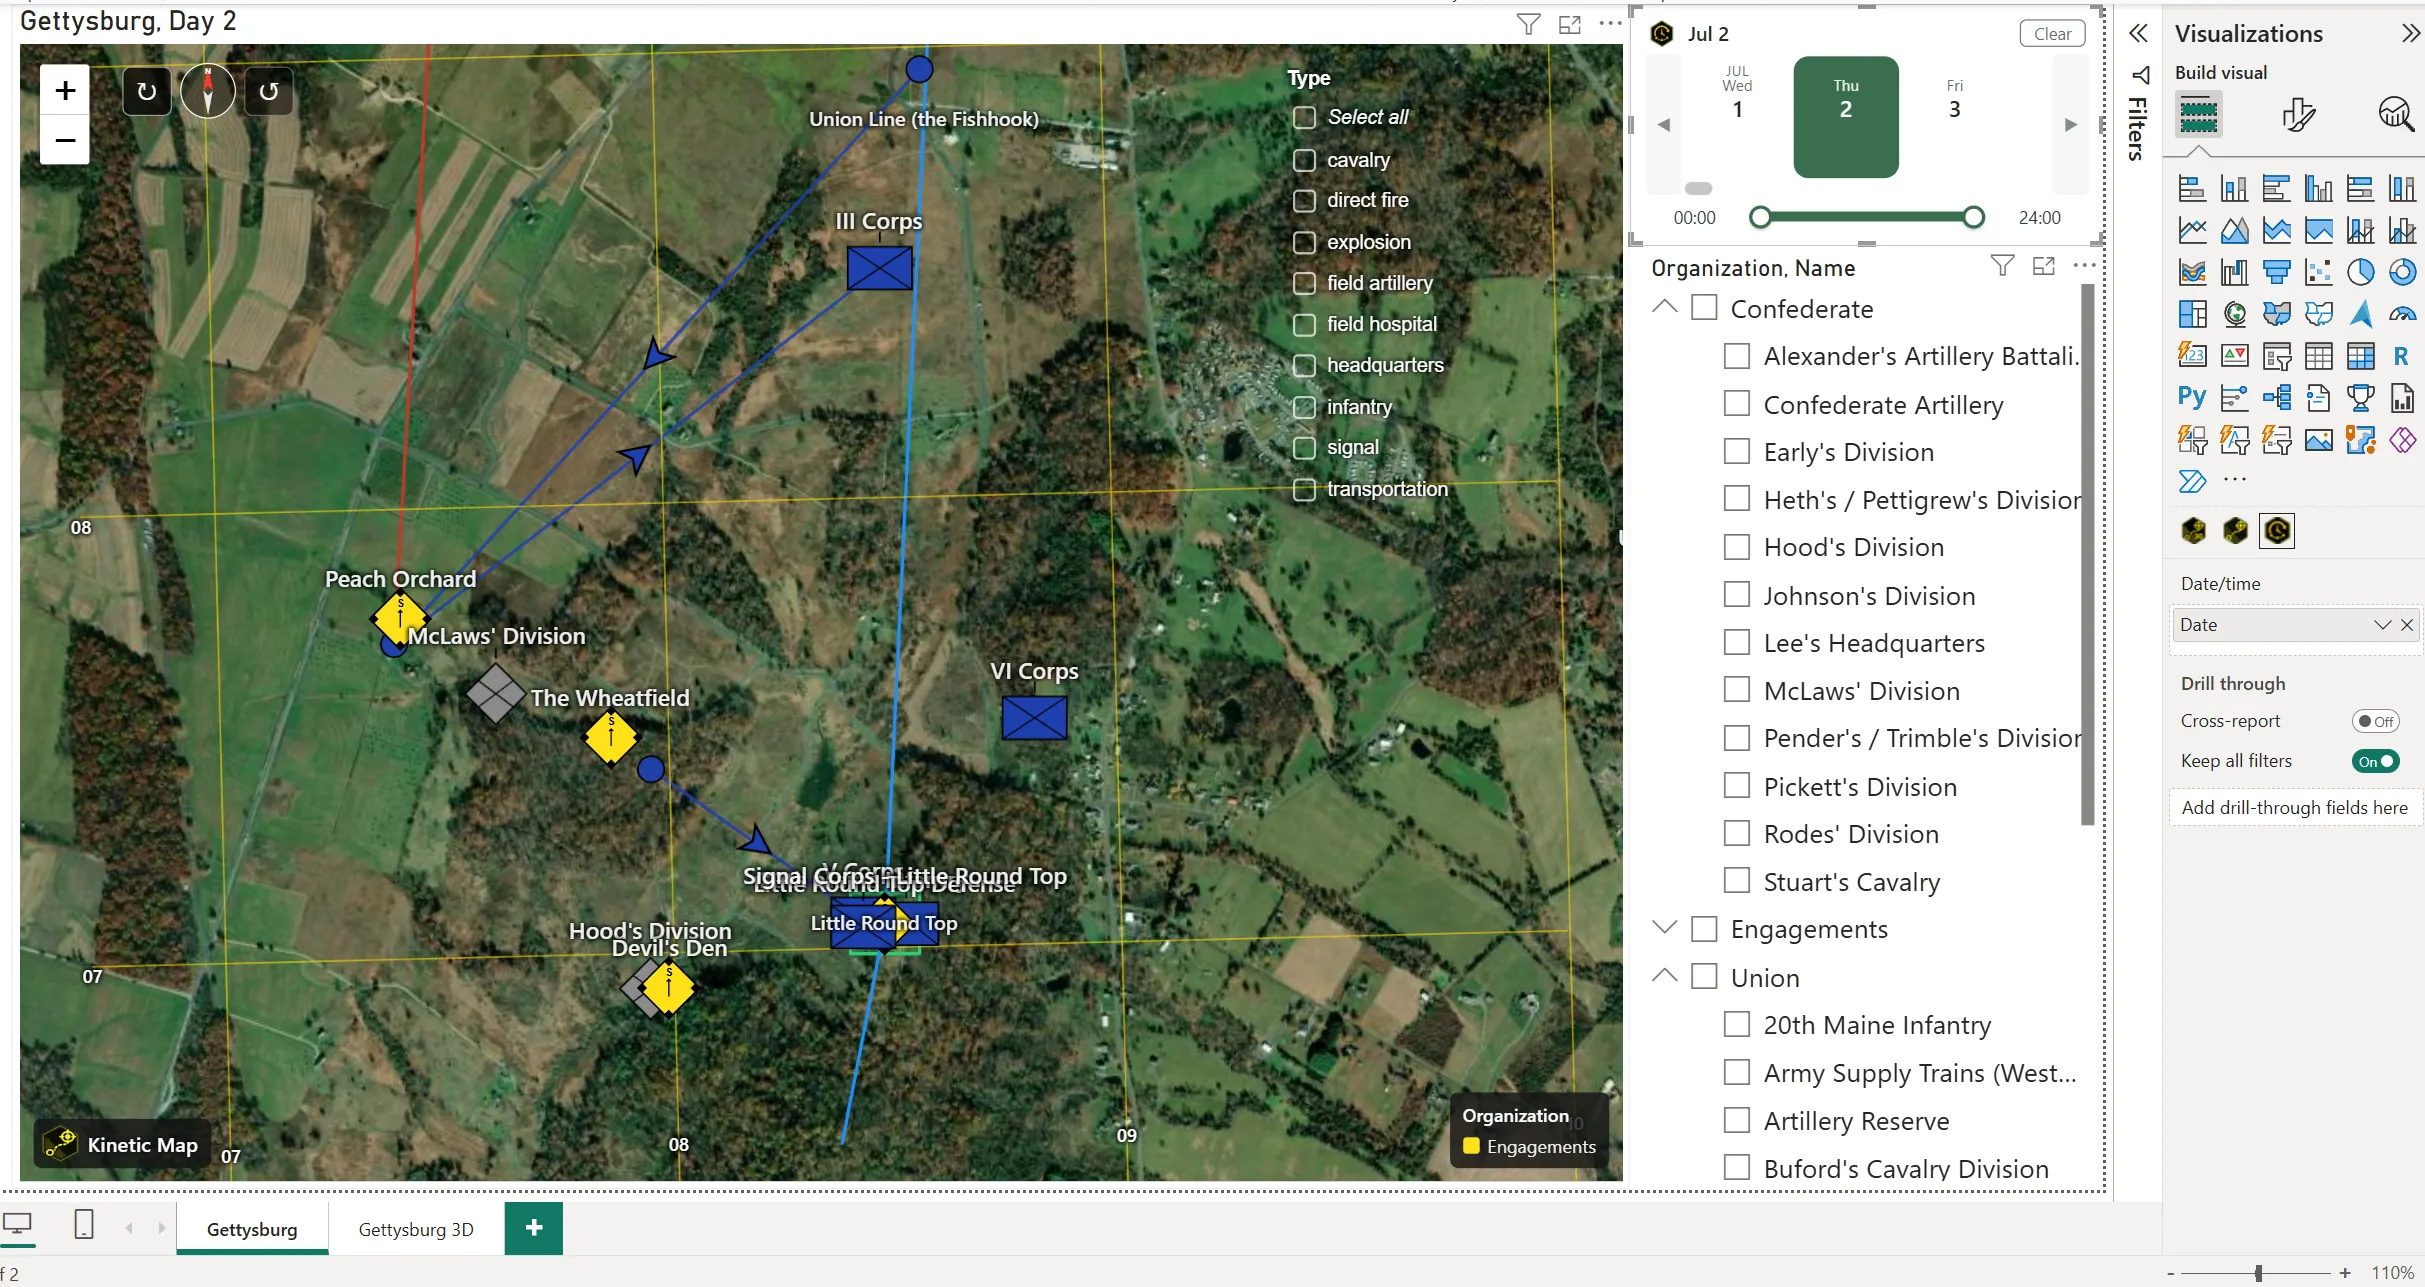
The day-strip timeline driving a Kinetic Map — the map shows only the units and events that fall inside the selected date.
Key features
Section titled “Key features”- Day-strip date selection — scroll to any date and ctrl + click or click-drag to select single days or a contiguous range.
- Within-day time filter — drag a time-of-day slider to scope fast-moving events down to the hour inside a single day.
- Historical-date support — handles dates earlier than standardized time zones, so you can faithfully recreate historical events. The 1863 Gettysburg sample relies on this.
- Customizable coloring — many pre-made color schemes plus custom color overrides.
- Page-wide sync — emits a standard Power BI filter that scopes every visual on the page.
- No external calls — all processing happens locally inside Power BI.
Pairing with the maps
Section titled “Pairing with the maps”Bind the Timeline’s Date field to the same column you bound to the map’s Date field well. Both visuals then agree on what “today” means, and the map’s movement trails will draw only the segments inside the selected range.
Getting started
Section titled “Getting started”Follow the Kinetic Timeline tutorial, or read the support page for the field-well reference and troubleshooting.
Download
Section titled “Download”Latest release v1.4.1.0released August 25, 2026
| Visual | File | Size | |
|---|---|---|---|
| Kinetic Timeline | KineticTimeline.pbiviz | 0.0 MB | Download |
Import into Power BI via Insert → Get more visuals → Import a visual from a file. Also available: all releases and theGettysburg sample report.