
Kinetic Suite for Power BI
Three visuals, one report
Section titled “Three visuals, one report”The suite is designed to work together: either map plots your units and events, and the timeline scopes the whole report page to a date or a range. Each visual is independent, so you can use one on its own.
What it’s for
Section titled “What it’s for”Recreate a battlefield, or run a live Common Operating Picture. Bind your data to
the field wells and the suite handles symbology, placement, and time. Coordinates can be
Military Grid Reference System strings or decimal lat/long. Symbols accept a plain-English
name such as infantry or field artillery as readily as a raw 15-character SIDC — there
are 339 named symbols across units and events.
Everything renders inside Power BI. The maps make no external call other than fetching basemap tiles, and the Timeline makes none at all.
See it in action
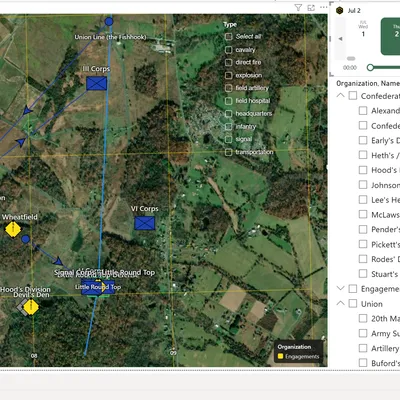
Section titled “See it in action”The screenshots throughout this site come from the included Gettysburg sample report — the second day of the Battle of Gettysburg, July 2 1863, with every unit and engagement plotted from MGRS grid references and scoped to a single day by the Timeline. It relies on the Timeline’s support for dates that predate standardized time zones.
Download
Section titled “Download”Latest release v1.4.1.0released August 25, 2026
| Visual | File | Size | |
|---|---|---|---|
| Kinetic Map | KineticMap.pbiviz | 0.3 MB | Download |
| Kinetic Map 3D | KineticMap3D.pbiviz | 0.5 MB | Download |
| Kinetic Timeline | KineticTimeline.pbiviz | 0.0 MB | Download |
Import into Power BI via Insert → Get more visuals → Import a visual from a file. Also available: all releases and theGettysburg sample report.
Get Kinetic Suite updates
New releases, new symbology, and tutorials — sent when there's something worth sending, and nothing else.