
Kinetic Map 3D
$19.99/month·all three in the Suite Bundle for$24.99/month·Pricing and licensing
The same operational picture, with terrain that matters. Kinetic Map 3D takes the same data model and symbology as Kinetic Map and drapes it over a photorealistic 3D globe — so elevation, defilade, and line of sight are visible rather than inferred.
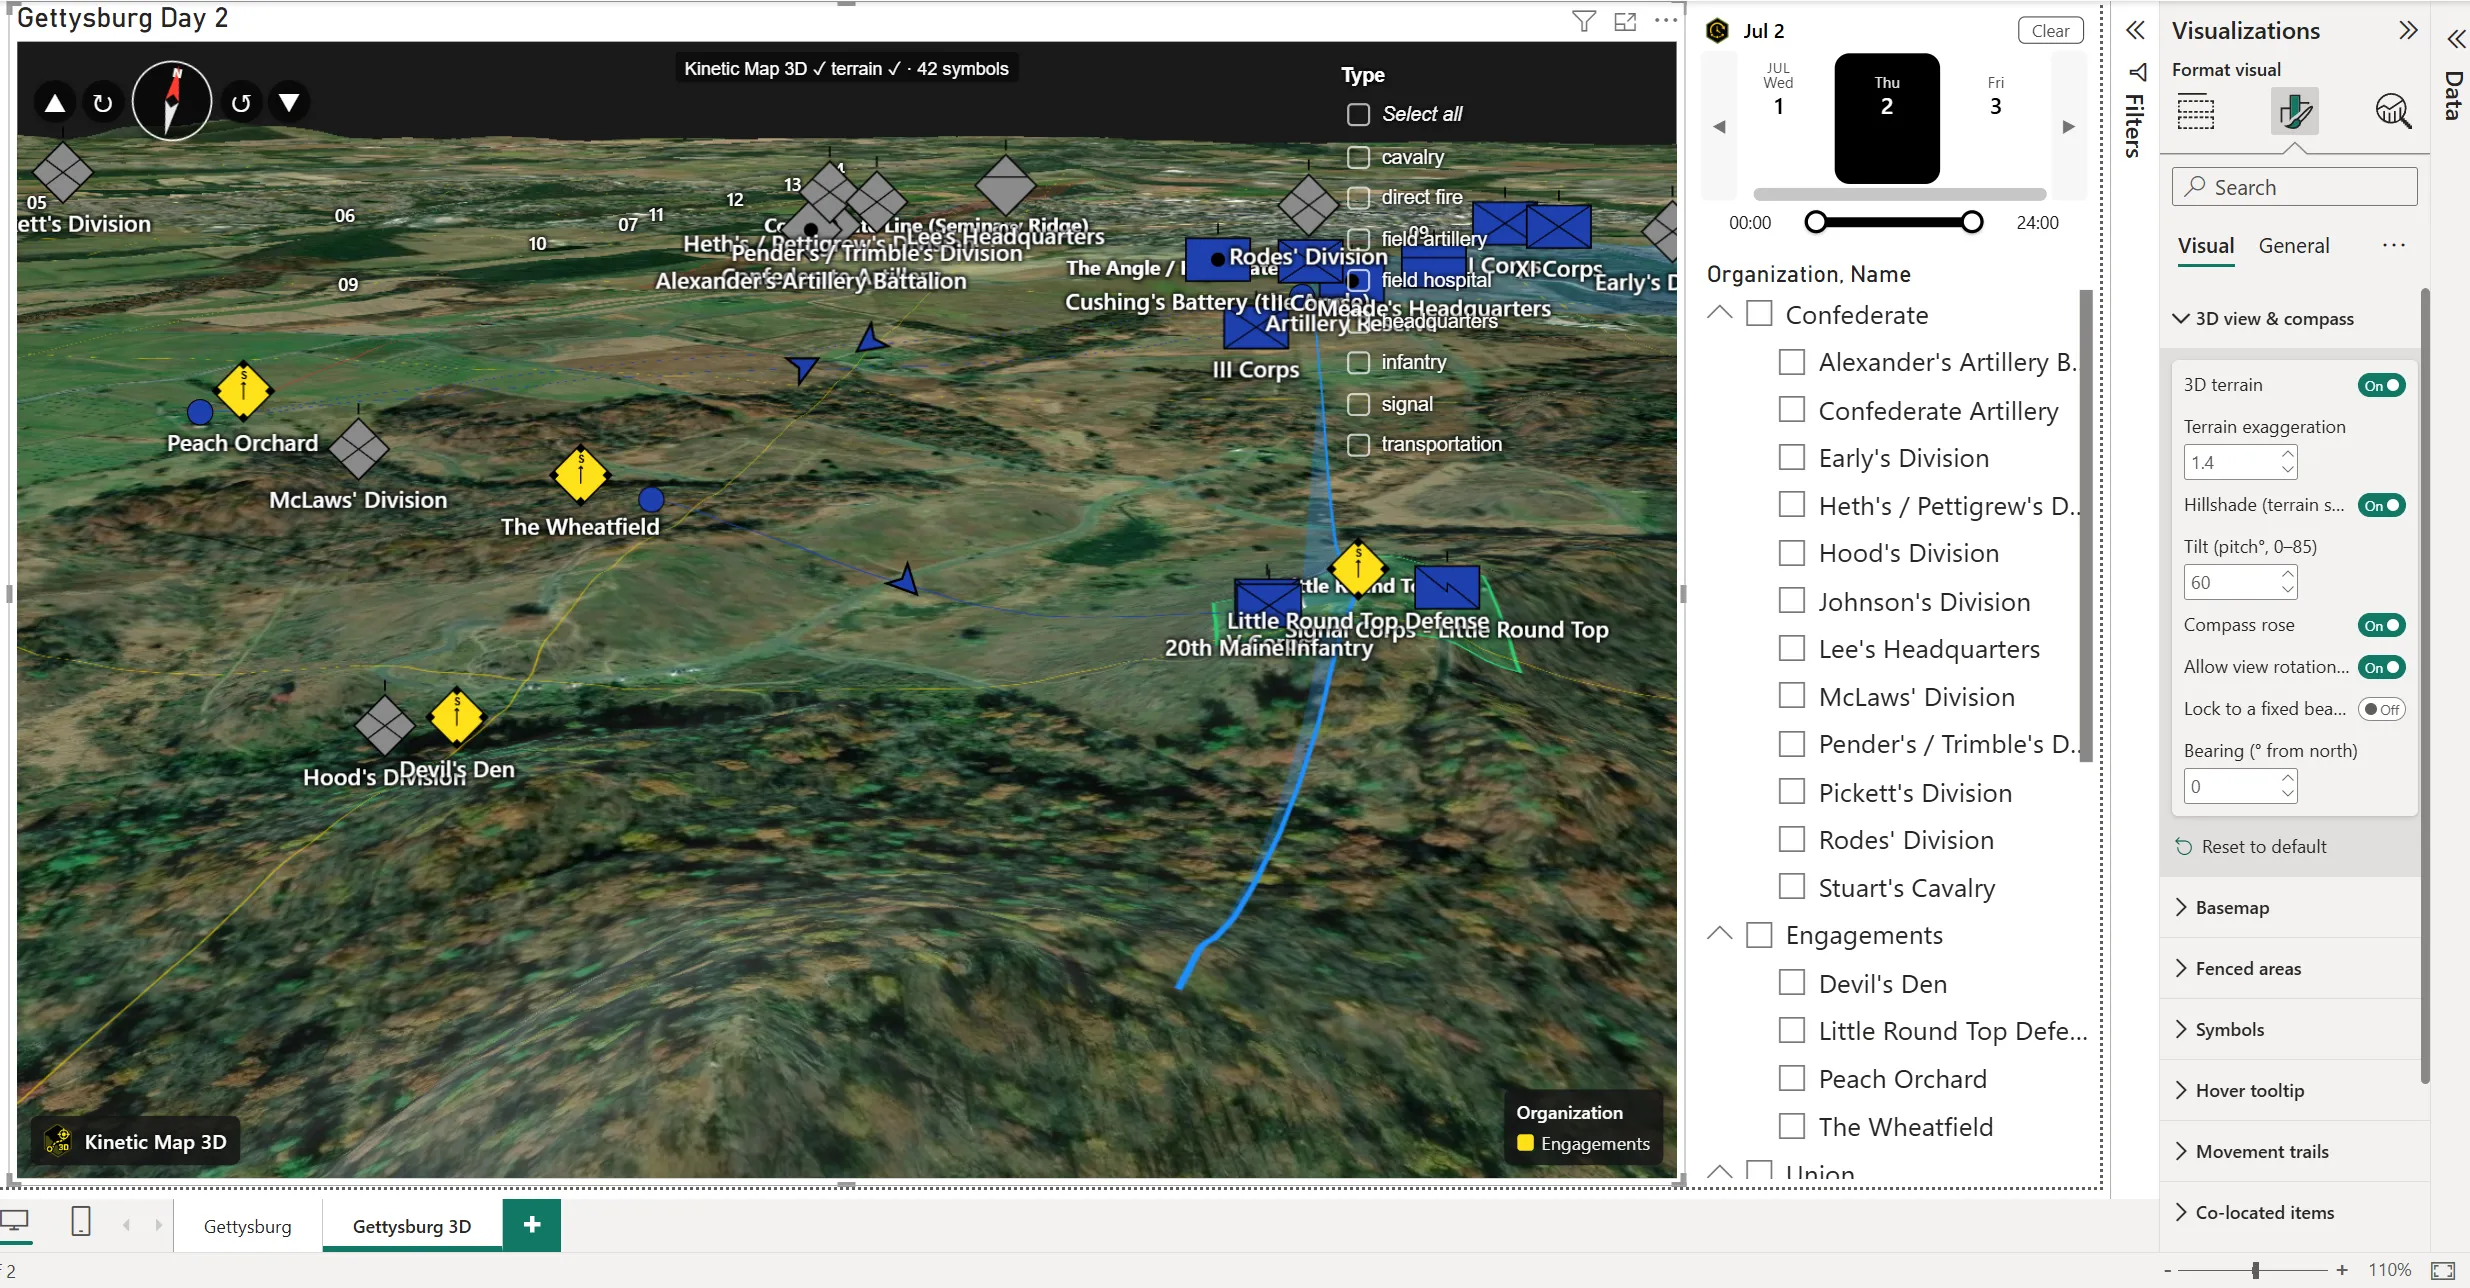
The same data and symbols draped over a photorealistic 3D globe with terrain, hillshade, and a compass for free view rotation.
What 3D adds
Section titled “What 3D adds”Everything on the Kinetic Map feature list applies here too — 2525C symbology, MGRS and lat/long plotting, movement trails, geofences, co-located stacking, and the on-map category filter. On top of that:
- Photorealistic 3D terrain — real elevation data under the basemap, so ridgelines, valleys, and high ground read at a glance.
- Terrain exaggeration — scale vertical relief up or down to make subtle terrain legible without misrepresenting the geography.
- Hillshade — directional shading that makes landform obvious even on a flat-lit basemap.
- Compass rose and free view rotation — orbit, tilt, and re-orient the camera; the compass keeps north findable.
- 3D-aware symbol placement — symbols sit on the terrain surface rather than floating at sea level.
Which one should you use?
Section titled “Which one should you use?”Use Kinetic Map when the question is where, and you want the fastest, flattest, most legible answer — it renders lighter and reads better for dense urban or close-quarters data.
Use Kinetic Map 3D when the question involves terrain — elevation, observation, cover, or any engagement where the ground itself is part of the story. The Gettysburg sample is a good example: Little Round Top only makes sense in three dimensions.
Both accept identical field bindings, so you can drop one in place of the other, or put both on the same page driven by the same Kinetic Timeline.
Getting started
Section titled “Getting started”The Kinetic Map tutorial covers both visuals — the field wells and data model are the same. See the support page for the 3D-specific settings and troubleshooting.
Download
Section titled “Download”Latest release v1.4.1.0released August 25, 2026
| Visual | File | Size | |
|---|---|---|---|
| Kinetic Map 3D | KineticMap3D.pbiviz | 0.5 MB | Download |
Import into Power BI via Insert → Get more visuals → Import a visual from a file. Also available: all releases and theGettysburg sample report.