
Kinetic Map
$12.99/month·all three in the Suite Bundle for$24.99/month·Pricing and licensing
Build a live battlefield or Common Operating Picture inside Power BI. Kinetic Map plots your operational data as MIL-STD-2525C military symbols on satellite imagery, from MGRS grid references or decimal lat/long coordinates.
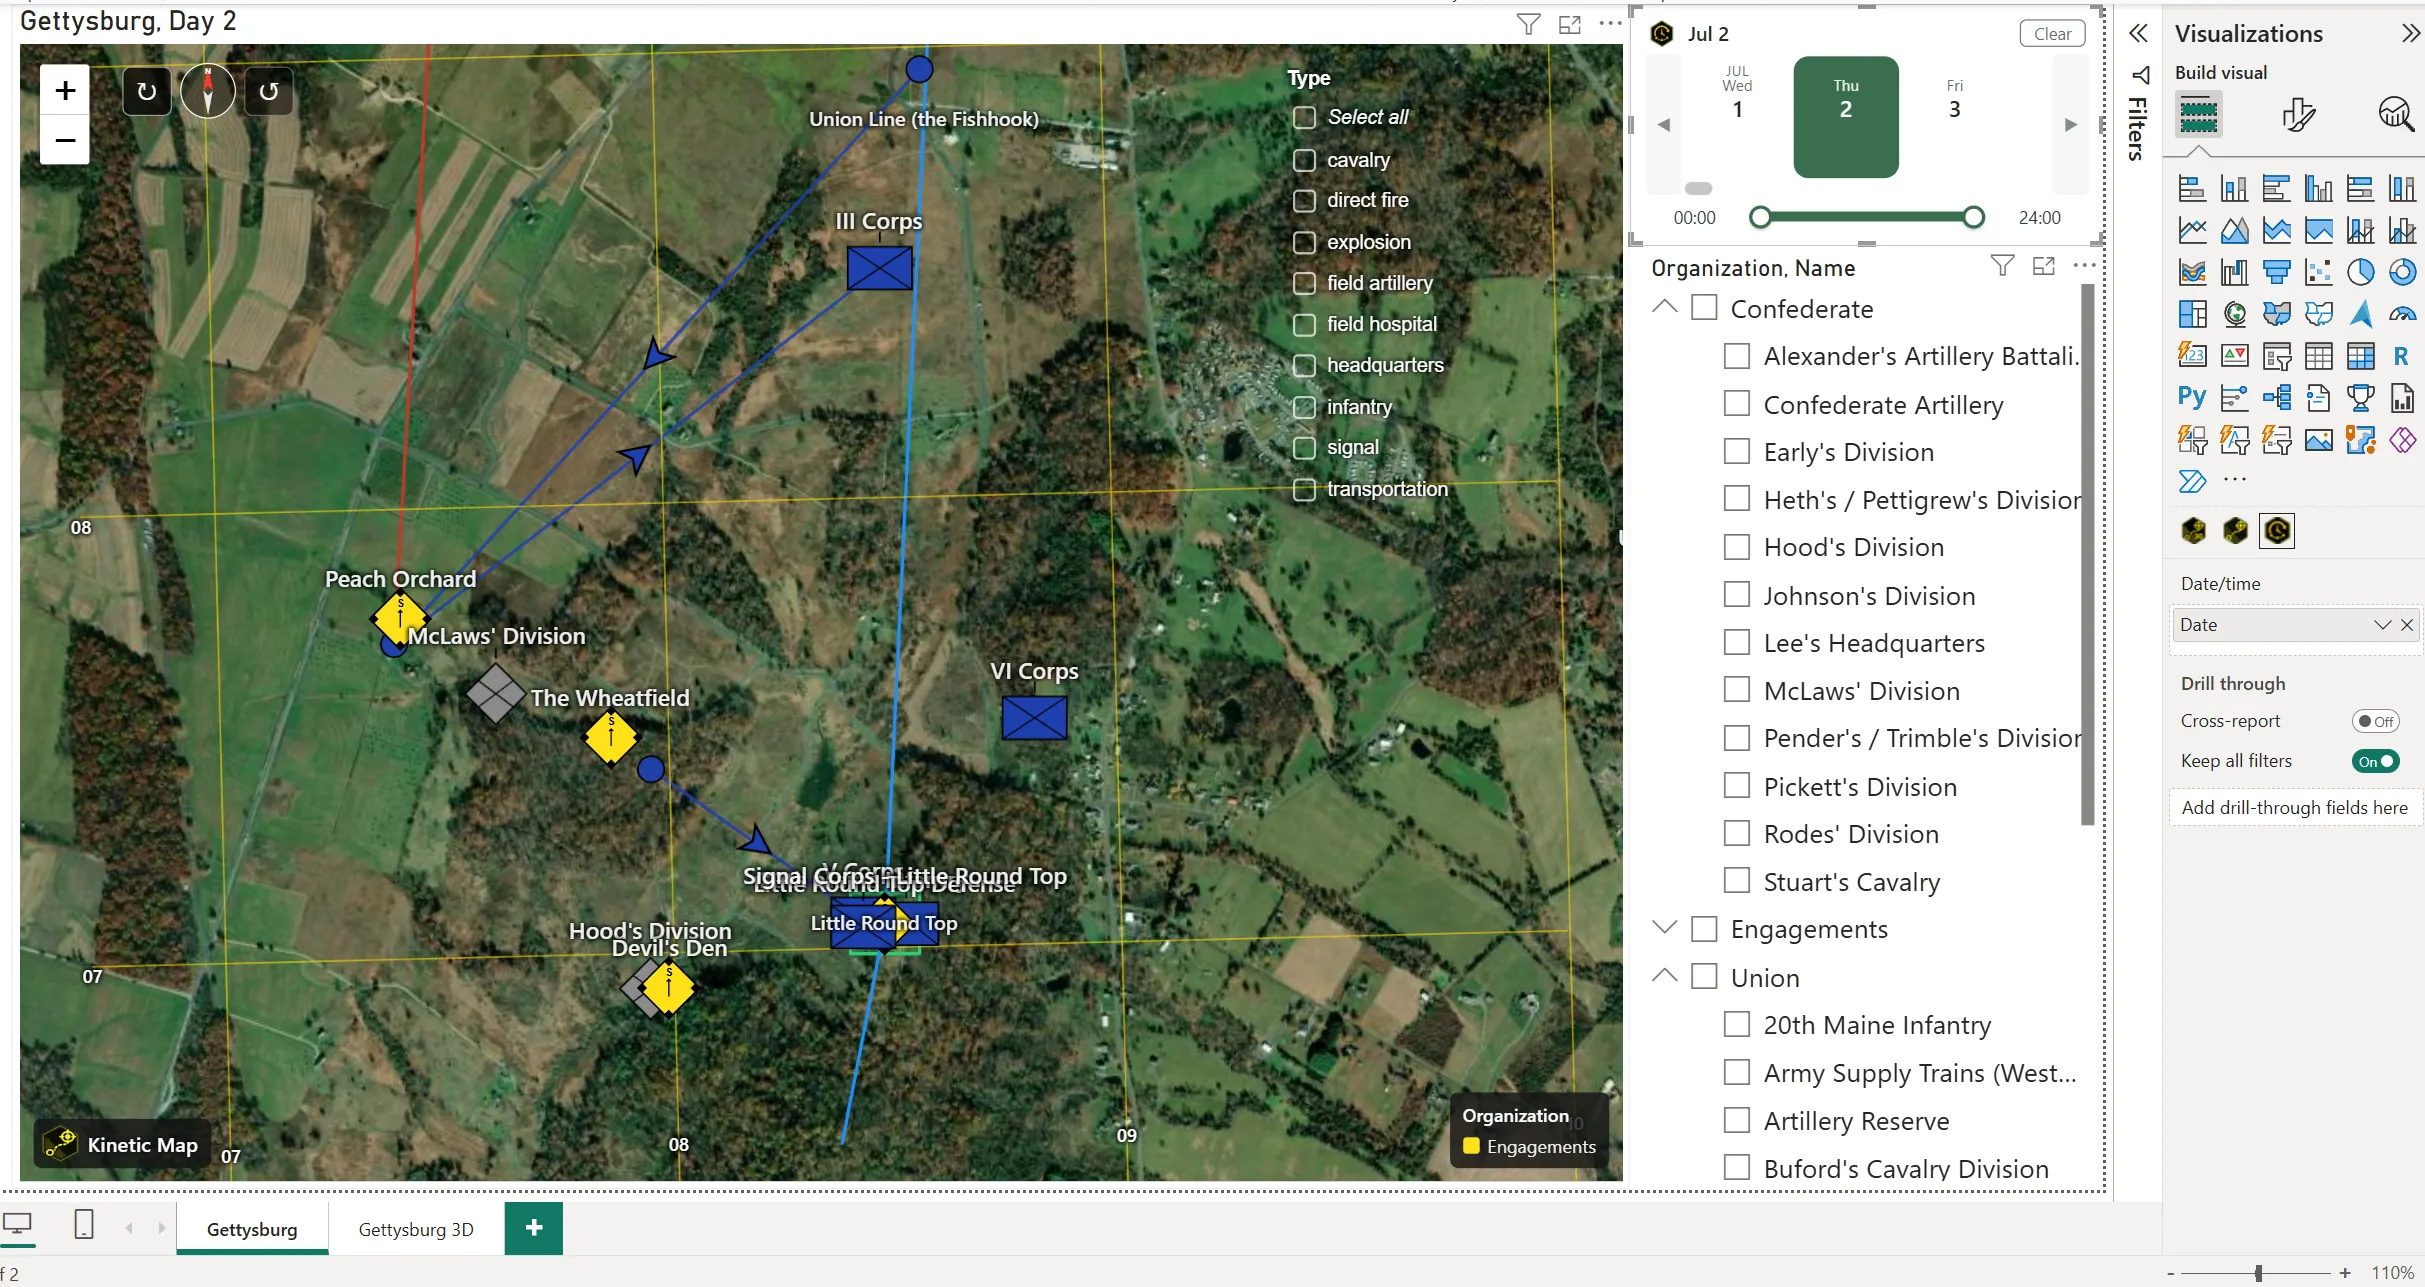
2525C unit and event symbols on satellite imagery, with a live MGRS grid overlay, movement trails, an on-map category filter, and the day-strip timeline driving the date.
Key features
Section titled “Key features”- MIL-STD-2525C symbology — the full 2525C unit and event symbol set, auto-colored by
affiliation (friendly, hostile, neutral, unknown). Type a plain-English alias such as
infantryorfield artilleryinstead of a raw symbol code. - MGRS or lat/long plotting — accepts Military Grid Reference System coordinates or decimal lat/long for both unit and event placement.
- Dynamic MGRS grid overlays — a zoom-adaptive grid (GZD → 100 km → 10 km → 1 km → 100 m) drawn live over the map.
- Movement trails — connect a unit’s positions over time to visualize maneuver and advance.
- Six map styles — satellite, hybrid, street, topographic, light-gray, and NatGeo basemaps.
- Area overlays and geofences — define fenced areas from inline GeoJSON, WKT, or a URL.
- Built-in overlay filter — an on-map category panel that filters the map’s own symbols and the rest of the report page.
- Co-located stacking — automatically spreads items sharing the same point so nothing hides behind another symbol.
- Custom hover-over information — choose exactly which fields appear in the tooltip.
- Deep customization — fine control over spacing, sizes, label gaps, and offsets.
Getting started
Section titled “Getting started”Follow the Kinetic Map tutorial for a walkthrough from an empty report to a working map, or read the support page for the field-well reference and troubleshooting.
The symbol reference lists every name the Symbol and Event: type fields accept.
Download
Section titled “Download”Latest release v1.4.1.0released August 25, 2026
| Visual | File | Size | |
|---|---|---|---|
| Kinetic Map | KineticMap.pbiviz | 0.3 MB | Download |
Import into Power BI via Insert → Get more visuals → Import a visual from a file. Also available: all releases and theGettysburg sample report.